% Created by LI Xu
% Version 1.0
% August 28, 2025


% If you have any question about this code,
% please do not hesitate to contact me via E-mail:
% jeremy456@163.com

% Blog:
% http://blog.sciencenet.cn/u/lixujeremy
% http://lixuworld.blogspot.com/

clear;
clc;
close all;

timebegin=tic;
cur_data=date;
cur_time=fix(clock);
str1=sprintf('%s %.2d:%.2d:%.2d', cur_data, cur_time(4), cur_time(5), cur_time(6));
fprintf('Time Begin: ');
fprintf(str1);
fprintf('\n');

import mlreportgen.ppt.*

% 1. Create a presentation
ppt = Presentation('AQ.pptx');

% 2. Create a slide (e.g., 'Blank' or 'Title and Content')
slide = add(ppt, 'Title and Content');
replace(slide, 'Title', 'Measured Data Table');

% 3. Prepare your data (Cell array: Rows x Cols)
data = {'Variable', 'Campus', 'Winnipeg'; 'Temperature (℃) ', '40', '15'; ...
    'Relative Humidity (%)', '65', '70'; ...
    'Wind speed (m/s)', '65', '70'; ...
    'PM2.5 (μg/m³)', '65', '70'; ...
    'PM10 (μg/m³)', '65', '70'; ...
    'NO₂ (ppb)', '65', '70'; ...
    'O₃ (ppb)', '65', '70'; ...
    'CO₂ (ppm)', '65', '70'};


% 4. Create and add the table
% 'Table' automatically creates rows/columns based on the data
tableObj = Table(data);
firstRow = tableObj.Children(1);

firstRow.Style = {BackgroundColor('#296080'), FontColor('white'), Bold()};
tableObj.Style = {HAlign('center'), VAlign('middle'), Border('solid'), RowHeight('0.3in')};
% tableObj.ColWidths = {'1.5in', '1.0in', '1.0in'};
% Column 3: 1.0 inches (Winnipeg)
spec1 = ColSpec('2.5 in');
spec2 = ColSpec('1.5 in');
spec3 = ColSpec('1.5 in');

% 2. Assign the array of specs to the table
tableObj.ColSpecs = [spec1, spec2, spec3];


% 1. Target the specific cell (Row 2, Column 2) using entry(row, col)
targetCell = entry(tableObj, 2, 2);

% 2. Apply the background color
targetCell.Style = {BackgroundColor('red')};

% 1. Target the specific cell (e.g., Row 2, Column 2)
targetCell = entry(tableObj, 2, 2);

% 2. Apply the font color (e.g., red)
% You can use names like 'red', 'white', or hex codes like '#FF0000'
targetCell.Style = [targetCell.Style, {FontColor('white')}];


% Add the table to the content placeholder
replace(slide, 'Content', tableObj);

% 5. Close and View
close(ppt);
rptview(ppt);


fprintf('Time Begin: ');
fprintf(str1);
fprintf('\n');
cur_data=date;
cur_time=fix(clock);
str2=sprintf('%s %.2d:%.2d:%.2d', cur_data, cur_time(4), cur_time(5), cur_time(6));
fprintf('Time End: ');
disp(str2);
timespan=toc(timebegin);
fprintf('Time Span: %.4f s\n', timespan);

disp('*************************************************************************');
Tuesday, May 12, 2026
Matlab: Table on the PPT created via Matlab
Thursday, April 9, 2026
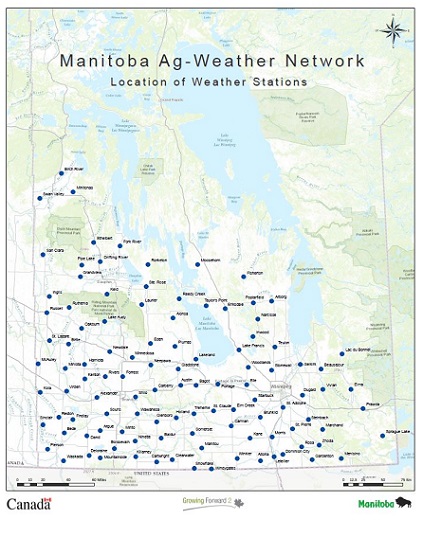
Data: Manitoba Ag-Weather Network Weather Stations
Manitoba Agriculture operates a network of over 100 weather stations across Manitoba's agricultural region which provide hourly updated air temperature, relative humidity, precipitation, wind speed and direction, soil temperature and soil moisture. The WeatherStations feature class displays the location of the weather stations and its table contains a link to current weather for each station. list
How to download
How to use them:
- Select a Station Name from the dropdown (they match the ones in your CSV).
- Pick a Date (or planting/end dates for seasonal).
- Submit to view the table for that station/date.
- Data goes back several years (stations have varying start dates, many from ~2011 onward, with 15-minute raw intervals rolled up to hourly/daily). Note: Raw data can have occasional sensor issues — use with caution.
Other useful pages:
- Current + summary pages: https://www.gov.mb.ca/agriculture/weather/weather-conditions-and-reports.html (links to the reports above + soil temps).
- Manitoba Ag Weather Program overview: https://www.gov.mb.ca/agriculture/weather/manitoba-ag-weather.html (confirms data is free and archived).
- Interactive current map: From the original dashboard or https://www.gov.mb.ca/agriculture/weather/current-ag-weather-conditions.html.
Code.
Thursday, April 2, 2026
Wednesday, March 18, 2026
Hysplit: To test Dry Deposition of Gases in HYSPLIT using a built-in example

- Prepare the Basic Run Setup (if not already done)
- Open the main Setup Run window.
- Set Total run time (hrs): e.g., 12 or 25 (tutorial uses 25 h for noticeable deposition).
- Set Direction: Fwd (forward).
- Add meteorology: Click Add Meteorology Files and select your file (e.g., oct1618.BIN).
- Click Setup starting locations → define 1 source (e.g., lat 40.0, lon -90.0, height 50 m, emission rate suitable for test).
- Set Pollutant & Deposition (Gas Dry Deposition)
- In main setup → click Pollutant, Concentration Grid, and Deposition setup.
- Under Pollutant: Num=1, select Specie 1.
- Under Deposition: Num=1, select Specie 1 → this opens the Deposition Definition window.
- In Deposition window:
- Particle or Gas: Gas.
- Dry Deposition: Yes.
- Wet Deposition: No.
- Preconfigure: Select I131g (built-in gaseous I-131 example; auto-loads realistic parameters like Vd ~0.006 m/s, molecular weight, Henry's law constants).
- Or manually: Set Vel(m/s) to 0.01 (1 cm/s, tutorial value for strong test).
- Leave other fields default/zero unless needed.
- Click green Save → close window.
- Add Ground Deposition Level to Concentration Grid
- In the same Pollutant, Concentration Grid, and Deposition setup window:
- Under Grids: Num=1 → click radio for Grid 1 (or double-click/label) → opens Definition of Concentration Grid 1.
- In Grid Definition window:
- Num of vertical levels: Change from 1 to 2.
- Height of levels(M Agl): Change to 0 100 (space-separated; 0 first for deposition accumulation, 100 for air concentration layer).
- Optional: Update Center of Lat and Lon to match your source (e.g., 40.0 -90.0).
- Keep spacing/span reasonable (e.g., 0.05 deg, 30 deg span).
- Output grid file name: Keep cdump or change.
- Click green Save → close.
- Run the Model
- Back in main Concentration Setup window → Save.
- Click Run Model (or equivalent button to execute HYSPLIT).
- Wait for completion → open the MESSAGE file in your working directory (text file named MESSAGE):
- Note the final total mass (near end, often in a NOTICE or summary line).
- Compare to initial emitted mass (early in file or from your emission setup: rate × duration).
- Look for vertical mass distribution tables (e.g., %Mass by height layer) — reduced low-level % indicates dry removal to ground.
- Compute % mass lost = (initial - final) / initial × 100. Tutorial expects ~10-14% for Vd=0.01 m/s over longer runs; shorter runs or lower Vd (like 0.006) show less.
- This confirms dry deposition occurred (mass removed from atmosphere).
- Display the Results (Air Concentration + Deposition Footprint)
- Go to Display → Concentration Contours (opens your Concentration Display window).
- Key settings:
- Input File: cdump (or your output name).
- Select Pollutant: All or your species (e.g., I131 / II131).
- Vertical Display: Show Each Level.
- From Bottom Level: 0 (deposition/surface).
- Through Top Level: 100 (air layer).
- Deposition Multiplier: Select Total (shows cumulative/total deposited mass over entire run; critical for seeing the full footprint instead of incremental amounts).
- Keep numeric field 1.0 (unless scaling units).
- Concentration Multiplier: 1.0.
- Uncheck Exposure if checked.
- Contour drawing options: Dyn-Exp (dynamic exponential; best for plumes).
- Label Source Rings: On (shows distance rings around source; set Number=4, Dist=100 km, Center to your source lat/lon).
- Output File: e.g., dry_depo_plot (unique name).
- View On: Checked.
- Click green Execute Display.
- What you'll see (sequence through frames):
- Air concentration frames (at 100 m level): Reduced plume due to deposition loss.
- Final/cumulative frame (level 0 with Total): Colored deposition footprint on ground (accumulated mass deposited as plume passed).
- If blank: Confirm level 0 in grid, Vd > 0, re-run if needed.


Monday, March 9, 2026
Matlab: Compress the file size for gif files
% ────────────────────────────────────────────────
% Compress large GIF → smaller GIF (same size, fewer colors)
% ────────────────────────────────────────────────

inputGif  = 'original.gif';      % ← change this
outputGif = 'compressed_version.gif';

[frames, map] = imread(inputGif, 'Frames', 'all');

if size(frames,3) == 3
    isRGB = true;
else
    isRGB = false;
end

nFrames = size(frames, 4);

% ── Super aggressive settings ──
nColors     = 16;          % try 12 or 8 if still too big
useDither   = false;       % no dither = smaller
delayFactor = 4.0;         % 4× slower → big size win
frameStep   = 3;           % keep only every 3rd frame (big reduction)

newFrames = cell(1, floor(nFrames / frameStep));
globalMap = [];

k = 1;
for i = 1:frameStep:nFrames
    if isRGB
        thisFrame = frames(:,:,:,i);
    else
        thisIndexed = frames(:,:,:,i);
        thisFrame   = ind2rgb(thisIndexed, map);
    end

    if k == 1
        if useDither
            [indexed, globalMap] = rgb2ind(thisFrame, nColors);
        else
            [indexed, globalMap] = rgb2ind(thisFrame, nColors, 'nodither');
        end
    else
        if useDither
            indexed = rgb2ind(thisFrame, globalMap);
        else
            indexed = rgb2ind(thisFrame, globalMap, 'nodither');
        end
    end

    newFrames{k} = indexed;
    k = k + 1;
end

% Timing – slow it down a lot
info      = imfinfo(inputGif);
origDelay = info(1).DelayTime / 100;
newDelay  = origDelay * delayFactor;
if newDelay < 0.05, newDelay = 0.05; end  % reasonable min

% Write
imwrite(newFrames{1}, globalMap, outputGif, 'gif', ...
    'LoopCount', Inf, ...
    'DelayTime', newDelay);

for kk = 2:numel(newFrames)
    imwrite(newFrames{kk}, globalMap, outputGif, 'gif', ...
        'WriteMode', 'append', ...
        'DelayTime', newDelay);
end

% Report
origSize = dir(inputGif).bytes  / 1e6;
newSize  = dir(outputGif).bytes / 1e6;
fprintf('MATLAB: %.0f MB → %.0f MB (%.0f%% smaller)\n', origSize, newSize, (origSize-newSize)/origSize*100);
disp(['Saved: ' outputGif]);
Sunday, February 15, 2026
Python: Detecting the Vehicle on the real-time footage
1 2 3 4 5 6 7 8 9 10 11 12 13 14 15 16 17 18 19 20 21 22 23 24 25 26 27 28 29 30 31 32 33 34 35 36 37 38 39 40 41 42 43 44 45 46 47 48 49 50 51 52 53 54 55 56 57 58 59 60 61 62 63 64 65 66 67 68 69 70 71 72 73 74 75 76 77 78 79 80 81 82 83 84 85 86 87 88 89 90 91 92 93 94 95 96 97 98 99 100 101 102 103 104 105 106 107 108 109 110 111 112 113 114 115 116 117 118 119 120 121 122 123 124 125 126 127 128 129 130 131 132 133 134 135 136 137 138 139 140 141 142 143 144 145 146 147 148 149 150 151 152 153 154 155 156 157 158 159 160 161 162 163 164 165 166 167 168 169 170 171 172 173 174 175 176 177 178 179 180 181 182 183 184 185 186 187 188 189 190 191 192 193 194 195 196 197 198 199 200 201 202 203 204 205 206 207 208 209 210 211 212 213 214 215 216 217 218 219 220 221 222 223 224 225 226 227 228 229 230 231 232 233 234 235 236 237 238 239 240 241 242 243 244 245 246 247 248 249 250 251 252 253 254 255 256 257 258 259 260 261 262 263 264 265 266 267 268 269 270 271 272 273 274 275 276 277 278 279 280 281 282 283 284 285 286 287 288 289 290 291 292 293 294 295 296 297 298 299 300 301 302 303 304 305 306 307 308 309 310 311 312 313 314 315 316 317 318 319 320 321 322 323 324 325 326 327 328 329 330 331 332 333 334 335 336 337 338 339 340 341 342 343 344 345 346 347 348 349 350 351 352 353 354 355 356 357 358 359 360 361 362 363 364 365 366 367 368 369 370 | #!/usr/bin/env python3 """ Vehicle Detector with Timestamp Logging Enhanced version: Logs timestamps for each vehicle and saves to daily log files """ import cv2 import numpy as np from picamera2 import Picamera2 import time import os from datetime import datetime, timedelta import json class VehicleDetectorLogger: def __init__(self): # Create log directory self.log_dir = "vehicle_logs" os.makedirs(self.log_dir, exist_ok=True) # Current log file self.current_log_date = datetime.now().date() self.log_file = self.get_log_file_path() # Initialize statistics self.vehicle_count = 0 self.vehicle_records = [] # Store all vehicle records self.daily_stats = self.load_daily_stats() # Detection parameters self.last_count_time = time.time() self.frame_count = 0 self.start_time = time.time() # Initialize camera print("Initializing camera...") self.picam2 = Picamera2() config = self.picam2.create_video_configuration( main={"size": (640, 480), "format": "RGB888"} ) self.picam2.configure(config) # Background subtractor self.fgbg = cv2.createBackgroundSubtractorMOG2(history=50, varThreshold=25) print("System ready!") print(f"Log file: {self.log_file}") print("-" * 50) def get_log_file_path(self): """Get log file path for current date""" date_str = datetime.now().strftime("%Y%m%d") return os.path.join(self.log_dir, f"vehicles_{date_str}.txt") def load_daily_stats(self): """Load daily statistics""" stats_file = os.path.join(self.log_dir, "daily_stats.json") if os.path.exists(stats_file): try: with open(stats_file, 'r') as f: stats = json.load(f) # Keep only last 7 days of data seven_days_ago = (datetime.now() - timedelta(days=7)).strftime("%Y%m%d") stats = {k: v for k, v in stats.items() if k >= seven_days_ago} return stats except: return {} return {} def save_daily_stats(self): """Save daily statistics""" stats_file = os.path.join(self.log_dir, "daily_stats.json") date_str = datetime.now().strftime("%Y%m%d") self.daily_stats[date_str] = { "total_vehicles": self.vehicle_count, "records_count": len(self.vehicle_records), "date": datetime.now().strftime("%Y-%m-%d") } with open(stats_file, 'w') as f: json.dump(self.daily_stats, f, indent=2) def log_vehicle(self, vehicle_id, timestamp, position=None): """Log vehicle detection to file""" # Check if need to switch to new day's log file current_date = datetime.now().date() if current_date != self.current_log_date: self.current_log_date = current_date self.log_file = self.get_log_file_path() print(f"New day! Switching to log file: {self.log_file}") # Format timestamp time_str = timestamp.strftime("%Y-%m-%d %H:%M:%S.%f")[:-3] # Create record record = { "id": vehicle_id, "timestamp": time_str, "unix_time": timestamp.timestamp(), "date": timestamp.strftime("%Y-%m-%d"), "time": timestamp.strftime("%H:%M:%S"), "position": position } # Add to records list self.vehicle_records.append(record) # Save to text file with open(self.log_file, 'a') as f: log_line = f"[{time_str}] Vehicle #{vehicle_id:04d} detected" if position: log_line += f" at position {position}" log_line += "\n" f.write(log_line) # Also save to JSON file (for easy analysis) json_file = self.log_file.replace('.txt', '.json') with open(json_file, 'w') as f: json.dump(self.vehicle_records, f, indent=2) # Print to console print(f"[{timestamp.strftime('%H:%M:%S')}] 🚗 Vehicle #{vehicle_id:04d} detected") return record def detect_and_count(self, frame): """Detect and count vehicles""" # Convert to grayscale gray = cv2.cvtColor(frame, cv2.COLOR_BGR2GRAY) # Apply background subtraction fgmask = self.fgbg.apply(gray) # Morphological operations kernel = np.ones((5,5), np.uint8) fgmask = cv2.morphologyEx(fgmask, cv2.MORPH_CLOSE, kernel) fgmask = cv2.morphologyEx(fgmask, cv2.MORPH_OPEN, kernel) # Find contours contours, _ = cv2.findContours(fgmask, cv2.RETR_EXTERNAL, cv2.CHAIN_APPROX_SIMPLE) detected_vehicles = [] for contour in contours: area = cv2.contourArea(contour) if area > 1000: # Only process large enough areas x, y, w, h = cv2.boundingRect(contour) # Only focus on bottom half of screen if y > 240 and w > 50 and h > 50: # Calculate center point center_x = x + w // 2 center_y = y + h // 2 # Check if new vehicle (avoid duplicate counting) current_time = time.time() if current_time - self.last_count_time > 2.0: self.vehicle_count += 1 self.last_count_time = current_time # Log vehicle timestamp = datetime.now() position = {"x": center_x, "y": center_y, "w": w, "h": h} record = self.log_vehicle(self.vehicle_count, timestamp, position) detected_vehicles.append({ "bbox": (x, y, w, h), "center": (center_x, center_y), "area": area, "record": record }) else: # Just draw, don't count detected_vehicles.append({ "bbox": (x, y, w, h), "center": (center_x, center_y), "area": area, "record": None }) return detected_vehicles, fgmask def draw_detection_info(self, frame, vehicles, fgmask): """Draw detection information on frame""" # Draw detected vehicles for vehicle in vehicles: x, y, w, h = vehicle["bbox"] center_x, center_y = vehicle["center"] # Draw bounding box color = (0, 255, 0) if vehicle["record"] else (0, 200, 200) thickness = 2 if vehicle["record"] else 1 cv2.rectangle(frame, (x, y), (x + w, y + h), color, thickness) # Draw center point cv2.circle(frame, (center_x, center_y), 4, (0, 0, 255), -1) # If counted vehicle, show ID if vehicle["record"]: cv2.putText(frame, f"#{vehicle['record']['id']}", (x, y - 10), cv2.FONT_HERSHEY_SIMPLEX, 0.6, (0, 255, 0), 2) # Draw detection line detection_line_y = 320 cv2.line(frame, (0, detection_line_y), (640, detection_line_y), (0, 255, 255), 2) cv2.putText(frame, "Detection Line", (10, detection_line_y - 10), cv2.FONT_HERSHEY_SIMPLEX, 0.5, (0, 255, 255), 1) # Display statistics stats_y = 30 cv2.putText(frame, f"Vehicles: {self.vehicle_count}", (10, stats_y), cv2.FONT_HERSHEY_SIMPLEX, 1, (0, 255, 0), 2) # Display FPS self.frame_count += 1 if self.frame_count % 30 == 0: fps = self.frame_count / (time.time() - self.start_time) cv2.putText(frame, f"FPS: {fps:.1f}", (10, stats_y + 40), cv2.FONT_HERSHEY_SIMPLEX, 0.7, (255, 255, 0), 2) # Display current time current_time = datetime.now().strftime("%Y-%m-%d %H:%M:%S") cv2.putText(frame, current_time, (350, 30), cv2.FONT_HERSHEY_SIMPLEX, 0.7, (255, 255, 255), 2) # Display today's date date_str = datetime.now().strftime("%Y-%m-%d") cv2.putText(frame, f"Today: {date_str}", (350, 70), cv2.FONT_HERSHEY_SIMPLEX, 0.7, (255, 255, 255), 2) # Display log status log_status = f"Log: {os.path.basename(self.log_file)}" cv2.putText(frame, log_status, (10, stats_y + 80), cv2.FONT_HERSHEY_SIMPLEX, 0.6, (200, 200, 255), 1) return frame def generate_daily_report(self): """Generate daily report""" if not self.vehicle_records: return # Count by hour hourly_counts = {} for record in self.vehicle_records: hour = datetime.fromtimestamp(record["unix_time"]).strftime("%H:00") hourly_counts[hour] = hourly_counts.get(hour, 0) + 1 # Generate report file report_file = self.log_file.replace('.txt', '_report.txt') with open(report_file, 'w') as f: f.write("=" * 60 + "\n") f.write(f"Daily Vehicle Detection Report\n") f.write(f"Date: {datetime.now().strftime('%Y-%m-%d')}\n") f.write("=" * 60 + "\n\n") f.write(f"Total Vehicles Detected: {self.vehicle_count}\n") f.write(f"Detection Start Time: {datetime.fromtimestamp(self.start_time).strftime('%Y-%m-%d %H:%M:%S')}\n") f.write(f"Report Generated: {datetime.now().strftime('%Y-%m-%d %H:%M:%S')}\n\n") f.write("Hourly Statistics:\n") f.write("-" * 30 + "\n") for hour in sorted(hourly_counts.keys()): f.write(f"{hour}: {hourly_counts[hour]} vehicles\n") f.write("\nDetailed Records:\n") f.write("-" * 60 + "\n") for i, record in enumerate(self.vehicle_records, 1): f.write(f"{i:3d}. [{record['time']}] Vehicle #{record['id']:04d}\n") print(f"Daily report generated: {report_file}") def run(self): """Main detection loop""" print("Vehicle Detection System Starting") print("Controls:") print(" 'q' - Quit program") print(" 'r' - Reset counter") print(" 's' - Save current frame") print(" 'p' - Generate daily report") print(" '+' - Increase sensitivity") print(" '-' - Decrease sensitivity") print("-" * 50) # Start camera self.picam2.start() time.sleep(1) # Let camera stabilize try: while True: # Capture frame frame = self.picam2.capture_array() frame = cv2.cvtColor(frame, cv2.COLOR_RGB2BGR) # Detect and count vehicles vehicles, fgmask = self.detect_and_count(frame) # Draw detection info frame = self.draw_detection_info(frame, vehicles, fgmask) # Display frames cv2.imshow("Vehicle Detector with Logger", frame) cv2.imshow("Motion Mask", fgmask) # Handle keyboard input key = cv2.waitKey(1) & 0xFF if key == ord('q'): print("\nQuitting program") break elif key == ord('r'): self.vehicle_count = 0 self.vehicle_records.clear() self.last_count_time = time.time() self.fgbg = cv2.createBackgroundSubtractorMOG2(history=50, varThreshold=25) print("Counter reset") elif key == ord('s'): timestamp = datetime.now().strftime("%Y%m%d_%H%M%S") filename = f"snapshot_{timestamp}.jpg" cv2.imwrite(filename, frame) print(f"Frame saved: {filename}") elif key == ord('p'): self.generate_daily_report() elif key == ord('+'): # Increase sensitivity self.fgbg.setVarThreshold(max(10, self.fgbg.getVarThreshold() - 5)) print(f"Sensitivity increased: varThreshold={self.fgbg.getVarThreshold()}") elif key == ord('-'): # Decrease sensitivity self.fgbg.setVarThreshold(min(100, self.fgbg.getVarThreshold() + 5)) print(f"Sensitivity decreased: varThreshold={self.fgbg.getVarThreshold()}") except KeyboardInterrupt: print("\nUser interrupted") finally: # Cleanup resources self.picam2.stop() cv2.destroyAllWindows() # Save statistics self.save_daily_stats() # Generate final report self.generate_daily_report() # Output summary total_time = time.time() - self.start_time fps = self.frame_count / total_time if total_time > 0 else 0 print("\n" + "=" * 60) print("Detection System Stopped") print("=" * 60) print(f"Total Runtime: {total_time:.1f} seconds") print(f"Frames Processed: {self.frame_count}") print(f"Average FPS: {fps:.1f}") print(f"Total Vehicles Detected: {self.vehicle_count}") print(f"Log File: {self.log_file}") print(f"JSON Data: {self.log_file.replace('.txt', '.json')}") print("=" * 60) def main(): """Main function""" print("=" * 60) print("Raspberry Pi Vehicle Detection System - With Logging") print("=" * 60) # Create detector and run detector = VehicleDetectorLogger() detector.run() if __name__ == "__main__": main() |
Subscribe to:
Posts (Atom)