Friday, April 8, 2022

AMAP:获取POI

高德API获取POI,共分为四种方法:代码
[1] 关键字搜索,文本可以是结构化地址,例如:北京市朝阳区望京阜荣街10号;也可以是POI名称,例如:首开广场。
返回限定行政区域内,一些含有“关键字”或“关键类别(分类编码)”的POI,【MAIN_AMAP_POI_VIA_ADODE_BATCH.m】
[2] 经纬度坐标点附近搜索,在设定的范围内,按照关键字或POI类型搜索,【MAIN_AMAP_POI_VIA_PLACES_BATCH.m】
[3] 多边形搜索,在自定义多边形区域内进行搜索:
多边形按照shapefile矢量文件之范围,确定左上及右下矩形,作为多边形之范围,【MAIN_AMAP_POI_VIA_POLYGON_BATCH.m】
[4] ID搜索,按照POI的ID编号提取完整信息,【MAIN_AMAP_POI_VIA_IDCODE_BATCH.m】

参考文献

[1] 高德API:搜索POI. 2021-11-01
[3] 爬取高德poi数据. 2020-12-24. 有火星坐标转换代码可参考.

Tuesday, March 8, 2022

AMAP:行政区域+生成矢量边界

从高德API获得行政区边界,并利用边界经纬度生产矢量边界。Files

参考文献

Friday, March 4, 2022

AMAP: 地里编码/逆地理编码

地理编码:由文字地址取回经纬信息。从图上来看,高德API返回的经纬信息基本不差,可能其精度也是与地域及地址丰度相关,大致上城市范围精度较高。
逆地理编码:由经纬信息取回文字地址。从图上来看,高德API返回的文字地址稍有偏差,步行距离大致是1公里,精度也可以。

参考文献

Monday, February 28, 2022

Matlab: Web Crawler

在我,网络爬虫神技已经向往已久,然而此前一直未有仔细尝试。
今天,我就以一个简单网页为目标,做一次尝试,小试牛刀了解其中应用的功能,做一个简简单单的示范。
我也注意到,各网页其实HTML结构不同,每次还要具体分析,文字编码方式尤其是要注意,这是正确理解中文的有效方式。代码

References

Monday, February 21, 2022

MATLAB+GDAL: Zonal statistics

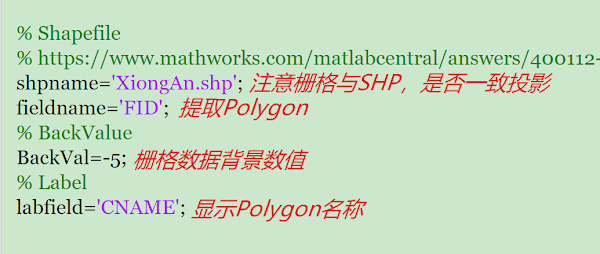
At first, I wanted to extract the raster values from the corresponding Polygon positions directly through MATLAB's built-in FUNCTION. However, after multiple attempts, although the code ran smoothly, the results were always incorrect. Therefore, I used a more labor-intensive method, which involved using the Polygon to crop first and then counting each cropped raster. The code needs to be referenced in conjunction with the Shapefile attribute table, as follows:(一开始,我希望通过MATLAB本身的FUNCTION直接从各栅格数据上提取到Polygon对应位置的栅格数值,可是尝试多次,代码虽然通畅,但结果总是不正确,所以就使用了一个最费事的方法,就是利用Polygon先裁剪,再统计各裁剪的栅格,代码需要结合Shapefile属性表,注意参照如下:)

Sunday, February 20, 2022

TeX: TexMaker+MikTex

安装顺序

安装MikTex,下载.
安装TexMaker,下载.
配置TexMaker,分为两步.

参考文献

Saturday, July 18, 2020

Code:多项参考

  1. [Matlab]删除XLS文件特定Sheet或空白Sheet(默认Sheet);
  2. [SPEI_SPI]计算栅格、站点;
  3. [Matlab]统计知网关键词词频;
  4. [Matlab]
  5. 1
    2
    3
    4
    5
    % Read Image
    [image, geo]=readgeoraster(imgpath);
    info=georasterinfo(imgpath);
    % Save Image
    geotiffwrite('newimg.tif', image, geo); 
    
    % read a geo-referenced image 
    [image, geo]=readgeoraster(filepath);
    
    try
        info=geotiffinfo(filepath);
    catch
        info=georasterinfo(filepath);
    end
    
    % write a geo-referenced image 
    try
        geotiffwrite(otpath, uint8(class_imag), geo);
    catch
        strcmd=['gdalinfo ', filepath];
        [~, cmdout]=system(strcmd);
        epsg=extractBetween(cmdout, "EPSG:"," got from GeoTIFF keys");
        epsg=epsg{1};
        % geotiffwrite(otpath, uint8(class_imag), geo, 'GeoKeyDirectoryTag', info.GeoTIFFTags.GeoKeyDirectoryTag);
        geotiffwrite(otpath, uint8(class_imag), geo, 'CoordRefSysCode', ['EPSG:', epsg]);
    end
    
    1
    geotiffwrite(otpath, uint8(class_imag), geo, 'CoordRefSysCode', ['EPSG:', epsg], 'TiffType', 'bigtiff');
    
    1
    geotiffwrite('m2.tif', image, geo, 'GeoKeyDirectoryTag', info.GeoTIFFTags.GeoKeyDirectoryTag);
    
  6. [Matlab] A powerful toolbox for exporting images, refer to the online documentation for usage instructions; to save images and prevent accidents, use export_fig('exportfig_painters.png', '-png', '-painters', '-r300');. When the image contains Chinese characters, refer to this code snippet: export_fig([name,'.png'], '-png', '-r400','-q300');.
  7. [Matlab] Get the parent folder path
  8.  1
     2
     3
     4
     5
     6
     7
     8
     9
    10
    11
    12
    13
    14
    15
    16
    17
    18
    19
    20
    21
    22
    %==========================================================================================================================
    % Gets the folder one level up.  If startingFolder is a filename with an extension it gets the containing folder and the child folder is null.
    % Returns null for both if the folder does not exist, and it's not a filename either.
    function [parentFolder, childFolder] = GetParentFolder(startingFolder)
    parentFolder = []; % Initialize
    childFolder = []; 
    try
    	if isfolder(startingFolder)
    		[parentFolder, childFolder, ext] = fileparts(startingFolder);
    		% Need to append extension for rare cases where deepest folder has a dot in the name.
    		childFolder = [childFolder, ext];
    	elseif isfile(startingFolder)
    		% It's a filename, not a folder.  Need to change otherwise childFolder will be returned as the base file name.
    		[parentFolder, childFolder, ext] = fileparts(startingFolder);
    		childFolder = []; % No child folder since it's a filename, not a folder name.
    	end
    catch ME
    	message = sprintf('Error in GetParentFolder():\n%s', ME.message);
    	uiwait(msgbox(message));
    end
    return; % from GetParentFolder
    end
    
  9. [Matlab]Export text on a text file.
  10. 1
    2
    3
    4
    fid=fopen(txtpath, 'w', 'n', 'US-ASCII');
    fprintf(fid, '%s\r\n', num2str(value));
    fclose(fid);
    fclose('all');
    
  11. [Matlab]Enhance RGB Image Code.
  12.  1
     2
     3
     4
     5
     6
     7
     8
     9
    10
    function enhan_image=GenenhanImage(filepath)
    %  https://www.mathworks.com/matlabcentral/fileexchange/64932-files-for-demystifying-deep-learning-semantic-segmentation-and-deployment?s_tid=srchtitle
         % Load the images located in the above path using imageDatstore - ML Function
        imds = imageDatastore(filepath);
        pic_num = 1;
        I_raw = readimage(imds, pic_num);
    
        enhan_image= histeq(uint8(I_raw)); 
    
    end
    
    1
    image=imadjust(image, stretchlim(image), []);
    
  13. [Matlab]To decrease computation time, use GPU processing, if it is available.
  14. 1
    2
    3
    4
    I = imread("peppers.png");
    if(canUseGPU)
        I = gpuArray(I);
    end
    
  15. [Matlab]输出图片的强大Toolbox,用法说明参考在线文档(可能需要翻墙)以export_fig('exportfig_painters.png', '-png', '-painters', '-r300');保存图片,避免意外情况;当图片包含中文字符时参考此段代码export_fig([name,'.png'], '-png', '-r400','-q300');;
  16. [Matlab]Figure全屏命令:set(gcf,'outerposition',get(0,'screensize'));;
  17. A GEO file in latitude-longitude projection.
  18. [Matlab]按比例在Plot上打上文字.
  19.  1
     2
     3
     4
     5
     6
     7
     8
     9
    10
    11
    12
    13
    14
    15
    16
    17
    18
    19
    20
    21
    % Add Text
    fnum=48;
    loX=0.568;
    laY=0.1;
    GenTextMap(loX, laY, t, fnum);
    
    function GenTextMap(loX, laY, yymm, fnum)
    
        % text(-94.78674012, 53.88222466, "   Island Lake", 'FontSize', 15)
        xxx=get(gca, 'XLim');
        yyy=get(gca, 'YLim');
    
        x=loX*(max(xxx)-min(xxx))+min(xxx);
        y=laY*(max(yyy)-min(yyy))+min(yyy);
    
        text(x, y, yymm, 'FontName', 'Arial', 'FontSize', fnum);


    end
    
    fnum=48;
    loX=0.1;
    laY=0.7;
    t=char(ia-1+97+5+5);
    t=['(', t, ')'];
    GenTextMapkk(loX, laY, t, fnum);
    function GenTextMapkk(loX, laY, yymm, fnum)
        xxx=get(gca, 'LatitudeLimits');
        yyy=get(gca, 'LongitudeLimits');
        x=loX*(max(xxx)-min(xxx))+min(xxx);
        y=laY*(max(yyy)-min(yyy))+min(yyy);
        text(x, y, yymm, 'FontName', 'Arial', 'FontSize', fnum);
    end
    
    fnum=90;
            loX=0.85;
            laY=0.5;
            t=dsname;
            GenTextMapCenter(loX, laY, t, fnum)
    function GenTextMapCenter(loX, laY, yymm, fnum)
        xxx=get(gca, 'LatitudeLimits');
        yyy=get(gca, 'LongitudeLimits');
        x=loX*(max(xxx)-min(xxx))+min(xxx);
        y=laY*(max(yyy)-min(yyy))+min(yyy);
        text(x, y, yymm, 'FontName', 'Arial', 'FontSize', fnum, 'HorizontalAlignment', 'center');
    end
    
  20. 世界各国边界(简化).
  21. 替换至NaN
  22. 1
    2
    3
    4
    5
    6
    7
    8
    9
    missing_idx = cellfun(@(x) is_missing(x), rawdat, 'UniformOutput', true);
    rawdat(missing_idx) = {NaN};
    
    function tf = is_missing(x)
        tf = false;
        if ismissing(x)
            tf = true;
        end
    end
    
  23. 自制图例
  24. 1
    2
    3
    4
    5
    6
    7
    8
    9
    % Add legend
    h = gobjects(3, 1);  % preallocate graphic handles
    h(1)=plot(-100, -100, 'hexagram', 'MarkerSize', 6, 'LineWidth', 1, 'MarkerEdgeColor', 'k', ...
        'MarkerFaceColor', 'none');
    h(2)=plot(-100, -100, 'o', 'MarkerSize', 6, 'LineWidth', 1, 'MarkerEdgeColor', 'none', ...
        'MarkerFaceColor', 'r');
    h(3)=plot(-100, -100, 'o', 'MarkerSize', 6, 'LineWidth', 1, 'MarkerEdgeColor', 'b', ...
        'MarkerFaceColor', 'none');
    legend(h, labels, 'Location', 'northwest');  % call once after the loop
    
  25. Convert a cell array of datetime to an array of datetime
  26. datcol=[datcol{:}];
    datcol=datcol';
    
  27. Multipal Plots
  28. Nh=4;
    Nw=17;
    gap=[0.00, 0.01];
    marg_h=[0.20];
    marg_w=0.05;
    figure;
    ha = tight_subplot(Nh, Nw, gap, marg_h, marg_w);
    set(gcf,'outerposition',get(0,'screensize'));
    
    
  29. annotation
  30. annotation('textbox', [0.1 0.936 0.8 0.06], ...
        'String', {'Number of Hours with PM2.5 Concentrations Exceeding 15 µg/m³ at Each Monitoring Station'}, ...
        'HorizontalAlignment', 'center', ...
        'VerticalAlignment', 'middle', ...
        'FontSize', 20, ...
        'FontWeight', 'bold', ...
        'LineStyle', 'none');
    
  31. export_fig
  32. otpath=fullfile('2Num2025');
    export_fig(otpath, '-png', '-painters', '-r300');
    pause(3);
    close all;