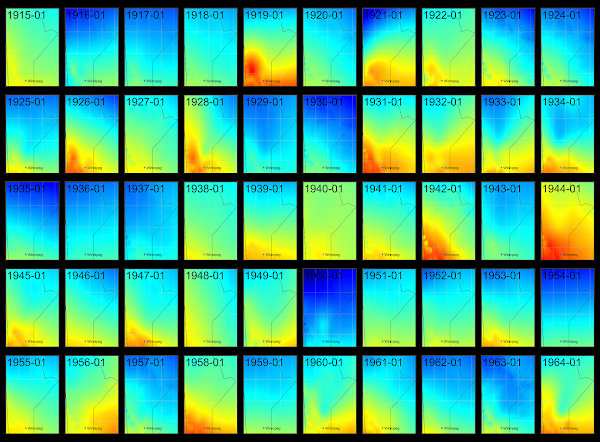
The weather observation data from the Manitoba meteorological station sites have been used as the input, and the local spatial distribution of temperature data for over a hundred continuous months has been obtained through ANUSPLIN interpolation. This is the foundation of our data analysis in this series.
This is the first part of the series, a January analysis, with a time range from 1915 to 2023. Temperatures are represented with deep red for higher temperatures and deep blue for lower temperatures. As shown in the following chart, over each decade, the frequency of warmer January temperatures has notably increased compared to cooler ones.
The temperature in January has been continuous for a total of 109 years, and our research divides them into three periods to calculate and identify their time series trends. From the calculated results, there is absolutely no significant time series trend in the study area between 1915 and 1964. In the other two periods, as shown in the following chart, the vast majority of areas show a significant warming trend. It was also found that the warming trend between 1965 and 2023 is noticeably higher than between 1915 and 2023.


No comments:
Post a Comment